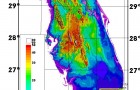
2000 Dade County E-W Transect
In March of the 2000, FIU deployed the ALTM 1210 system in Miami-Dade County in order to test the capabilities of the LIDAR system in a variety of environments. These environments include wetlands such as the Everglades, low and medium density suburban communities, the urban core of downtown Miami, and barrier island communities such as Miami Beach.
The deployment consisted of an E-W trending transect across the county and a N-S trending swath along the barrier island beaches of Key Biscayne and Miami Beach (Figure 1). The E-W transect consisted of 3 overlapping 400 meter wide swaths flown at an altitude of 600 m above the ground surface. These swaths were merged into a 1 km wide transect. The beach consisted of 2 coincident 300 meter wide swaths flown at an altitude of 500 meters. The irregularly spaced
point data were gridded to produce 1 m resolution digital elevation models (DEMs) and LIDAR return intensity grids.
Figure 1. Index map. The color swaths show the location of ALTM data collected in Miami-Dade and Broward County in 1999 – 2000. The red boxes denote the locations of the LIDAR images shown below.
Pseudocolored LIDAR Images
The images demonstrate various ways for combining the LIDAR DEMs and return intensity grids. For each image, either the elevation or the return intensity was mapped to a color table. Texture was provided by simulating shadows from the elevations or by mapping the intensity values to brightness. Images were produced with ERMapper image processing software. Click on the thumbnail images below to view the high resolution images.
Figure 2. Pseudocolored LIDAR heights with sun shading. Colors are proportional to the height. Reds correspond to high elevation. Texture shading was produced by artificial sunlight to the northeast which was applied to the elevation grid.
Figure 3. Pseudocolored LIDAR heights shaded with LIDAR intensity. Colors are proportional to the height. Blues correspond to low elevation. Reds correspond to high elevation. The bright band running down the center of the image was caused by specular reflections off the surface water directly beneath the aircraft.
The eastern margin of the Everglades, Miami-Dade County, FL.
The images show the eastern margin of the Everglades immediately south of Tamiami Trail (US 41) and to the west of the L31 canal and levee system. The highest features correspond to hardwood hammocks. These hammocks are surrounded by partially flooded sawgrass. The levee and canal form the eastern barrier to water flow out of the Everglades water conservation area. The feature to the east of the canal is the Krome Detention Center.
Figure 4. Pseudocolored LIDAR intensity with sun shading applied to the elevations. Colors are proportional to reflection intensity. Blues correspond to low reflection intensity. Reds correspond to high reflection intensity.
Florida International University Campus
Florida International University – Miami’s public research university – is one of America’s most dynamic institutions of higher learning. Since opening in 1972, FIU has achieved many benchmarks of excellence that have taken other universities more than a century to reach. The University has a nationally renowned full-time faculty, known for their outstanding teaching and cutting edge research; students from throughout the U.S. and more than 130 foreign countries; and its alumni have risen to prominence in every field and are a testament to the University’s academic excellence.
A member of the State University System of Florida, FIU is a research university offering a diverse selection of undergraduate, graduate and professional programs. Through its 16 colleges and schools, FIU offers more than 180 baccalaureate, master’s, and doctoral degree programs in more than 280 majors, conducts basic and applied research, and provides public service.
The images below show map and 3-D perspective views of the FIU main campus (University Park) located at 11200 SW 8th Street, in Miami, FL.
Figures 5 and 6. Pseudocolored shaded relief images of the FIU campus. Color is proportional to elevation with sun shading calculated from a synthetic light source to the east. The campus is bounded on the west by the Florida Turnpike and on the east by SW 107th Avenue. Three-dimensional perspective image is viewed looking northeast.
Figures 7 and 8. Pseudocolored LIDAR intensity with sun shaded relief images of the FIU campus. Colors are proportional to reflection intensity. Blues correspond to low reflection intensity. Reds correspond to high reflection intensity.. This image demonstrates the wide variety of ground reflectivity obtainable with LIDAR imagery. In this image, low reflectivity regions (blues) generally correspond to asphalt parking lots and lakes while high reflectivity regions (reds) most often correspond to grass.
Fisher Island
Fisher Iisland lies at the eastern end of the transect. It is a 216 acre, private island which is separated from the southern tip of Miami Beach by the Government Cut Channel. The island was originally developed in the 1920s as a winter estate by the Vanderbuilt family. It is named after Miami Beach pioneer developer Carl Fisher.
Figure 9. Pseudocolored LIDAR elevations of Fisher Island with sun shading. The highest elevations correspond to the oil storage tanks on the north side of the island and the condominiums on the south side of the island. Other notable features include waves off the eastern shore of the island. The black region in the center of the island is due to a data gap between adjacent swaths.
Figure 10. Pseudocolored LIDAR elevations of Fisher Island shaded with LIDAR reflection intensity. The highest elevations correspond to the oil storage tanks on the north side of the island and the condominiums on the south side of the island.
Figure 11. Pseudocolored LIDAR intensity with sun shading applied to the elevations. Colors are proportional to reflection intensity. Blues correspond to low reflection intensity. Reds correspond to high reflection intensity. The highest reflectivity corresponds to the grass on the golf course and to sand on the beach near the southeastern shore of the island. The lowest reflectivity corresponds to water and to asphalt tennis courts.